Using reports
Your reports can be accessed by going to Reporting on from the left navigation and clicking on History.
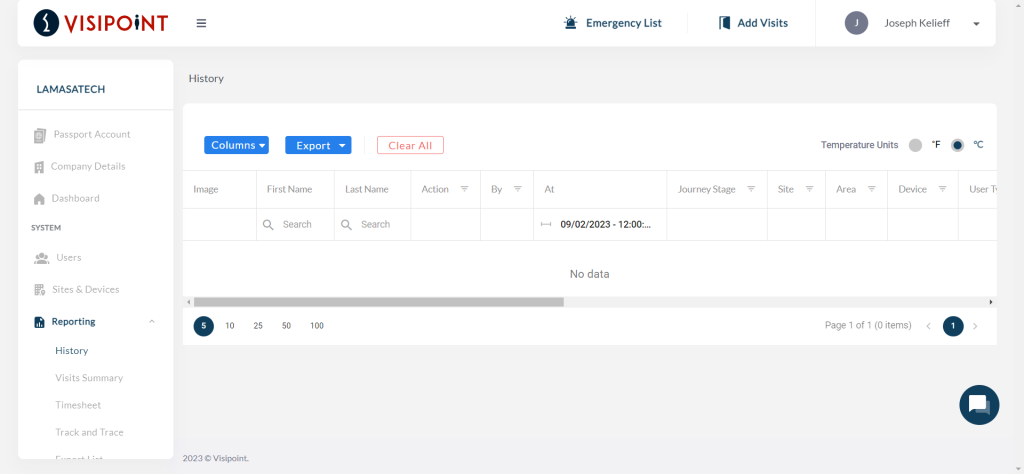
The reporting section includes a grid, which works the same way as the grid in the dashboard.
In the left section above the Grid area, you will see the display button that will allow you to choose how many logs are presented per page, you can choose between 10 to 100 based on your preference.
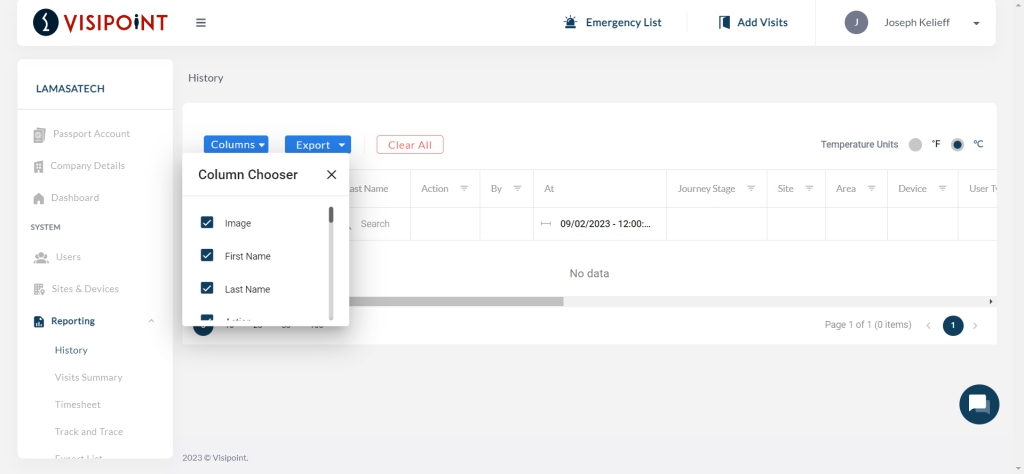
In the left section above the Grid area, you will see a blue dropdown that says Column and this will allow you to select which columns you would prefer to view these reports by.
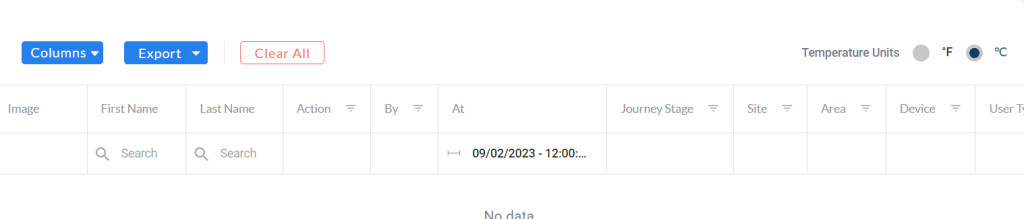
Below some columns headings will be search functions to allow you to identify the exact log you may wish to view.
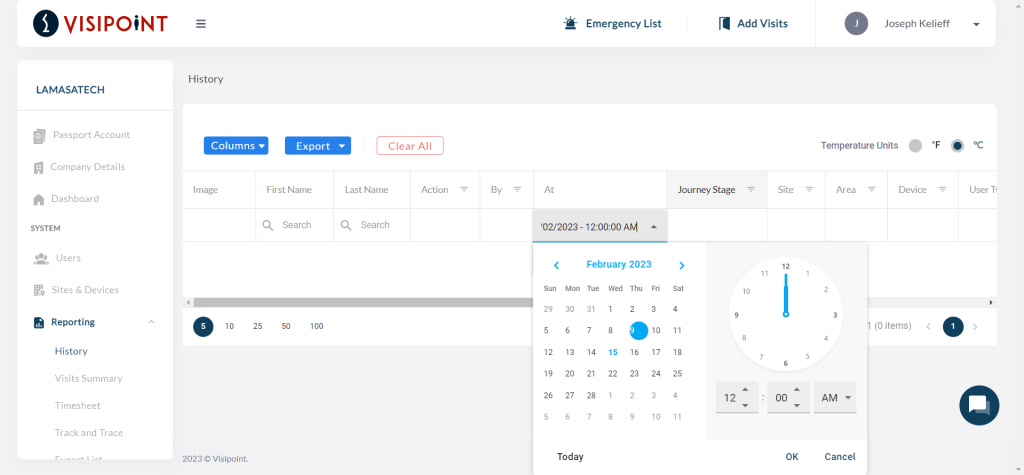
You can also choose to view between certain dates by selecting the date period column and then decide the range you want, as shown below.
If you have multiple kiosks and areas, you may wish to filter the logs by kiosk or area to get specific logs.
You can also convert the scan temperature unit to °F or °C by clicking on the Temperature units option on the top right of your grid.
You can filter the grid to specific temperature readings by using the moveable scale filter under temperature.
Exporting your logs
The export button allows you to export your data in Excel, CSV, or PDF format. The export option is located above the grid, next to your cog settings icon.
If you have applied filters, the export will only export the data for the filters applied. And all exported sheets will include all details like Compliance questions and answers.
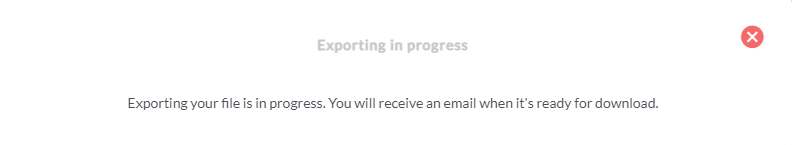
If you are exporting more than 100 records you will be notified that you will receive an email when it’s ready to download.
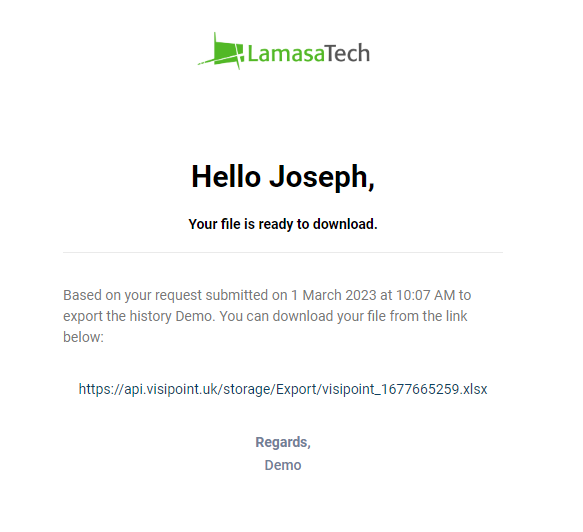
This is how the email will look like and it will include a link to download the exported file.
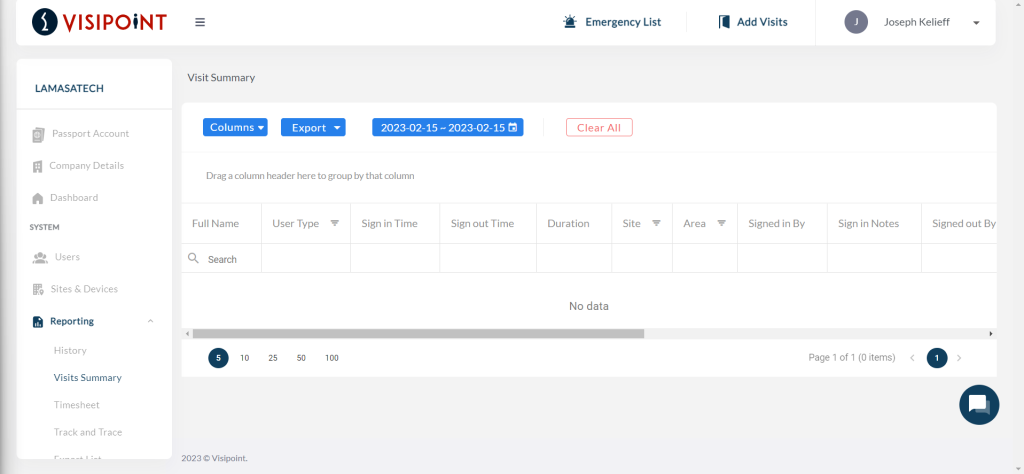
Visits Summary
The Visit Summary allows you to see a full list of all visits that have happened within your building. You can fine tune this by choosing the dates where you want to view and also change the columns to suit yourself by selecting the dropdown Column button.
It should be noted that when you are choosing a date range, you can only search for a maximum of 90 days.
Timesheet
Here you will see the most advanced piece of reporting functions. With this, you can produce reports longer than the 90 days restraint from the Visit Summary and also further decide the timeframe and User Types.
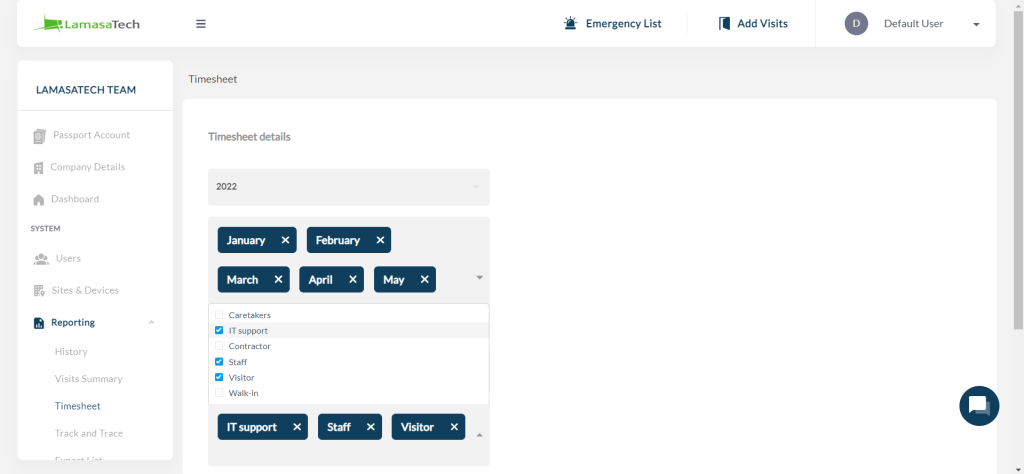
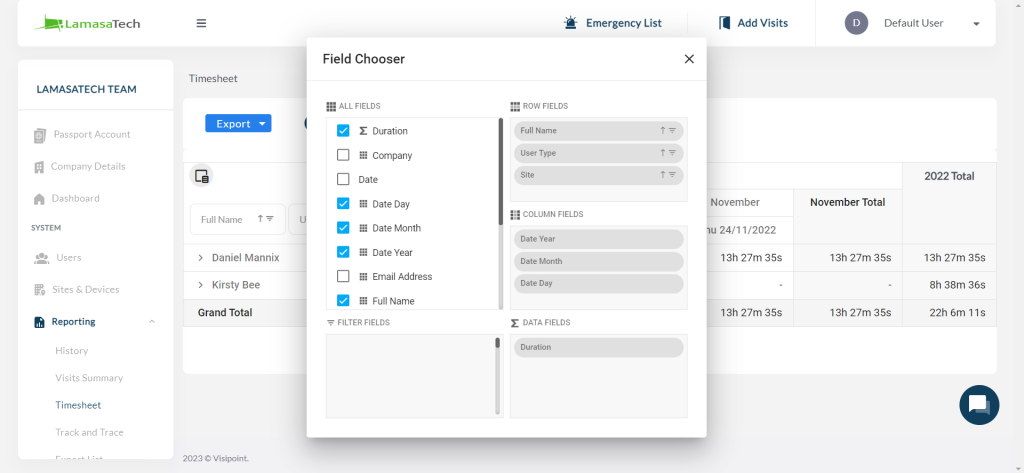
Once the report has been generated you can also further decide how the data can be viewed by the fields chosen which is located just above the fields you have originally chosen.
You can also export this timesheet to view on another platform if you wish.
Track and Trace
Below history, if you click on Track and Trace, and then select a user that we know has checked in using your kiosks and was present at your premises , you need also to select a time frame , then hit filter, the grid will populate with every user that has been in contact with selected user in that time range selected.
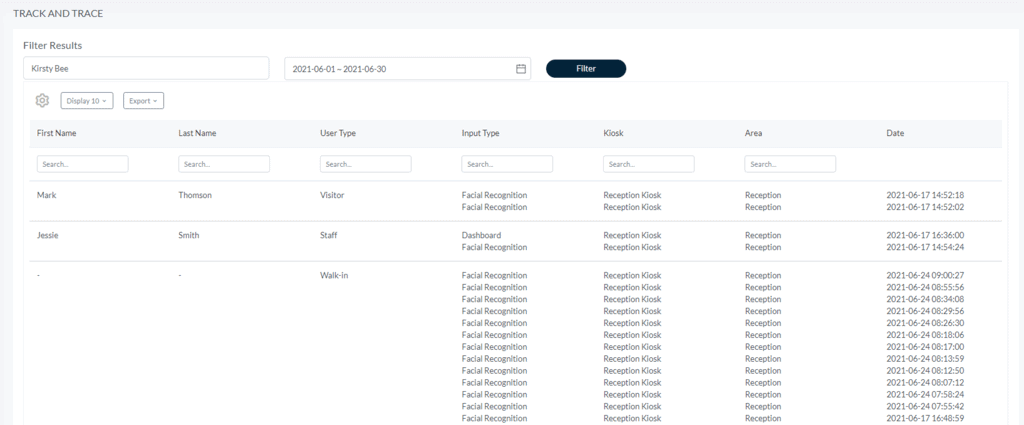
On the grid you will have all users names, user type, input method, the kiosk that was used, even the area and the dates and times that these users were in contact with the specific user you added.
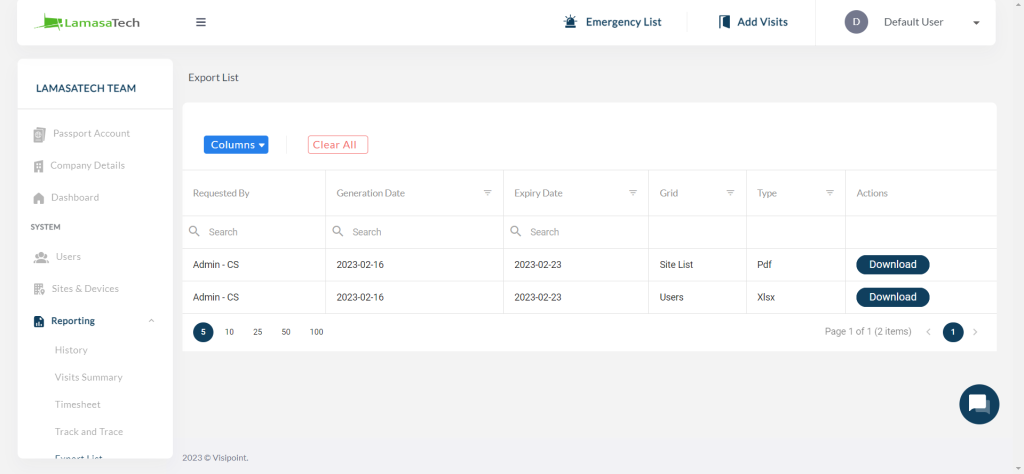
Export List
We can see any reports that we have exported in the past. We can then either download this report again if we require to and also search for a specific one from the search fields under the columns.
From here we can see who generated the report, when the report was generated and the type of file that it is.
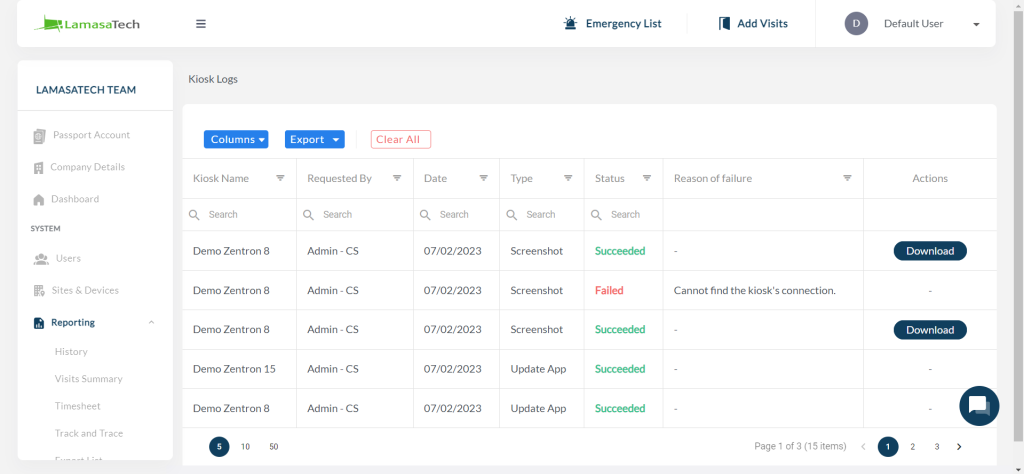
Kiosk Logs
We can clearly see any action that has been taken on any devices within your fleet.
Here we can see the Kiosk, who has requested the action to be done, the date it was requested and the type of action that happened. We can also clearly see the status of that action and the reason for any failures. If the action was completed we can download it to view excluding any updates to the system.