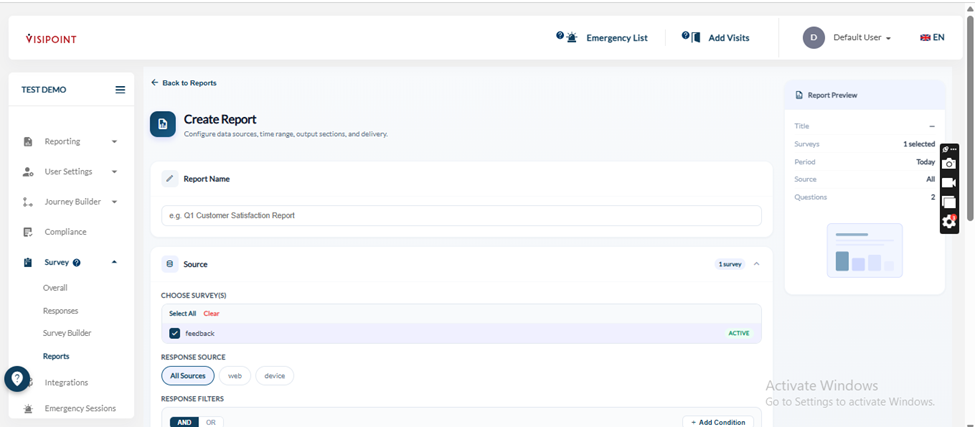
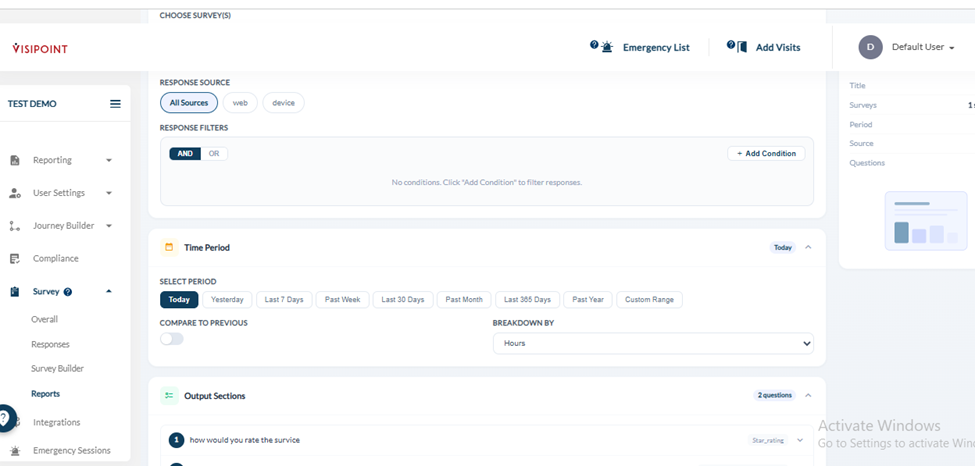
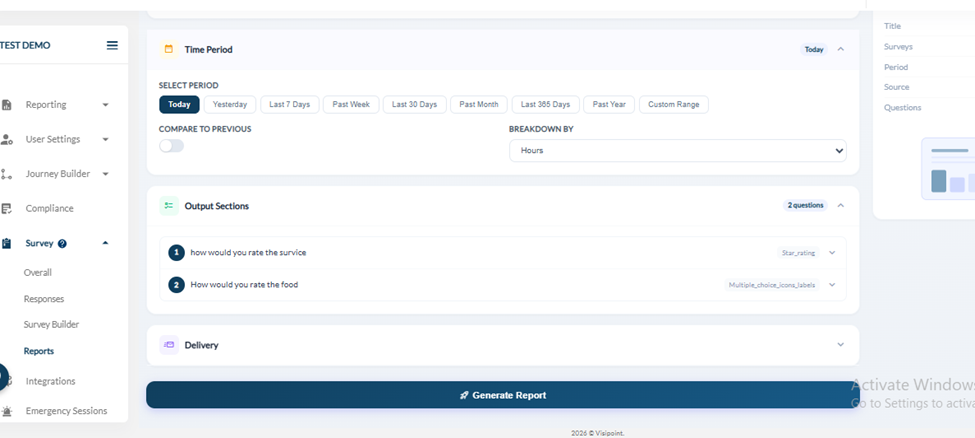
The survey module also has a separate reporting
- To check the overview of the survey, you go to the survey, then to the overall
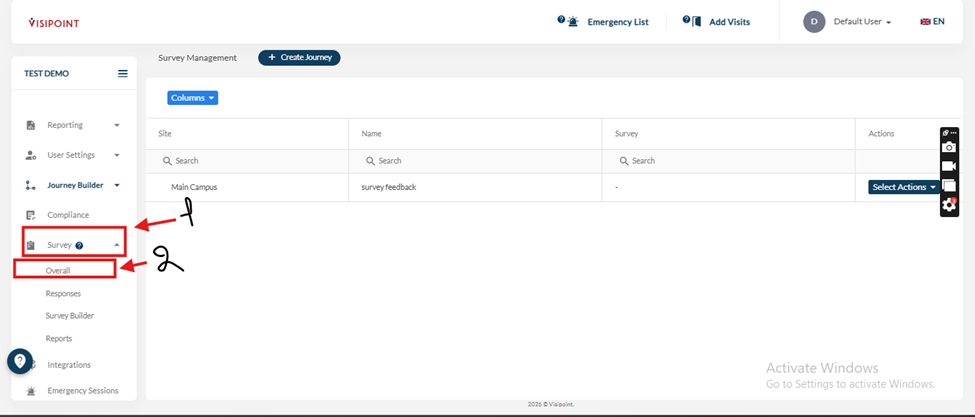
2. You can check the overview, matrix, performance, and averages
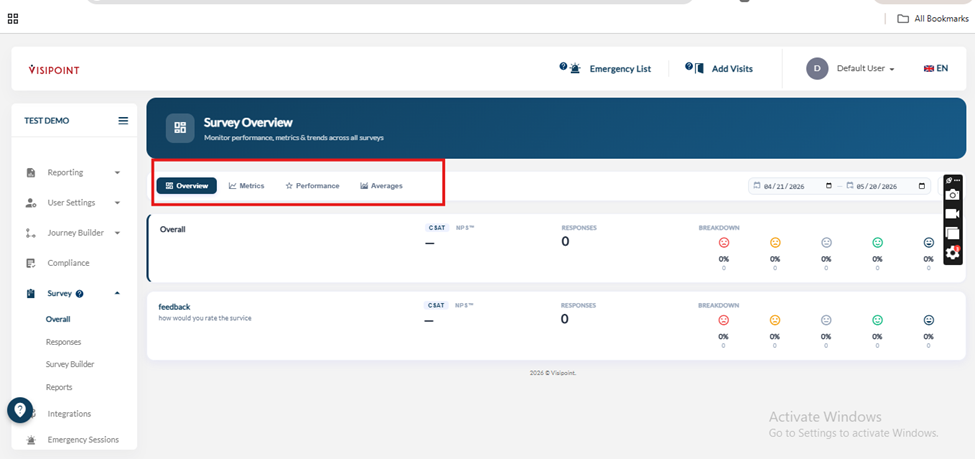
The overview had the reporting for CAST – NPS and the number of responses:
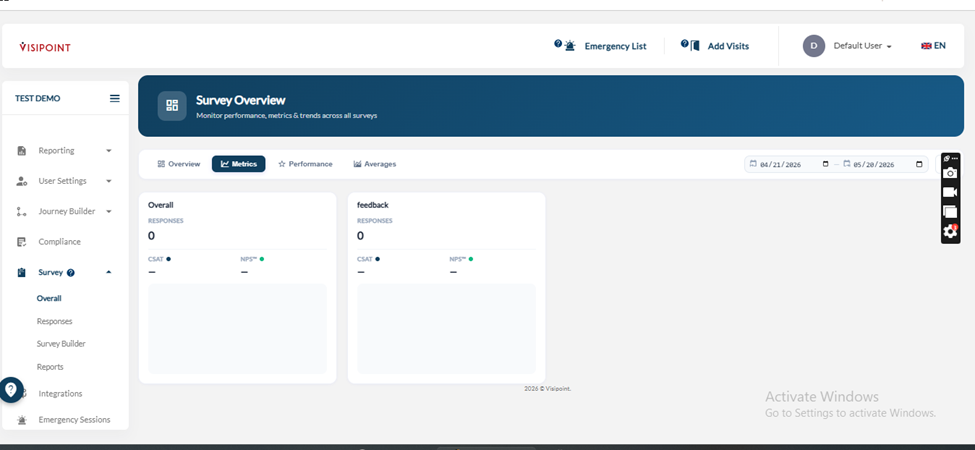
- This is how the matrix view looks
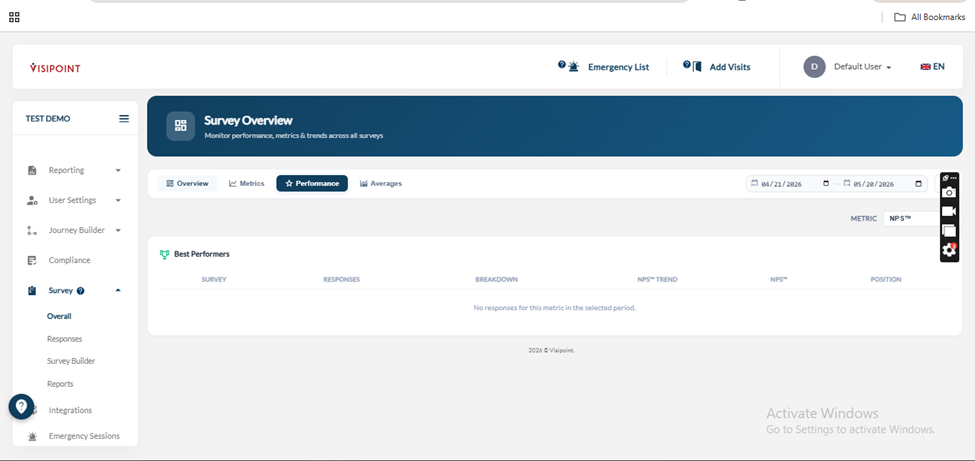
- Performance view.
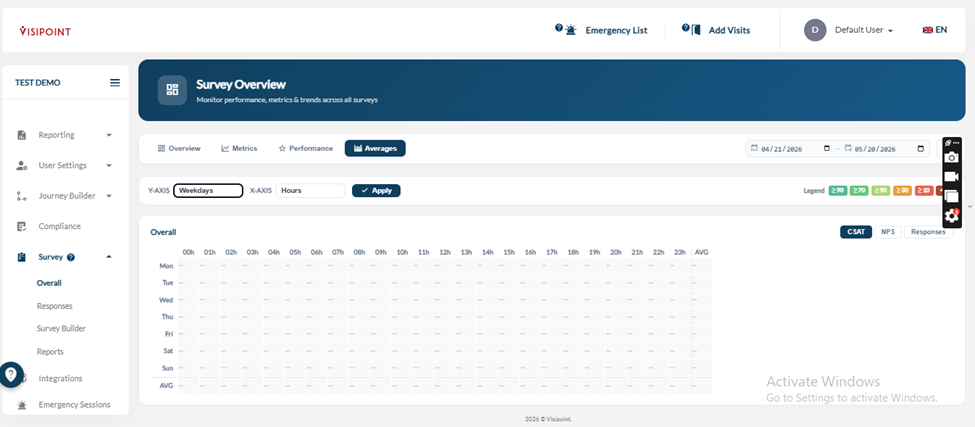
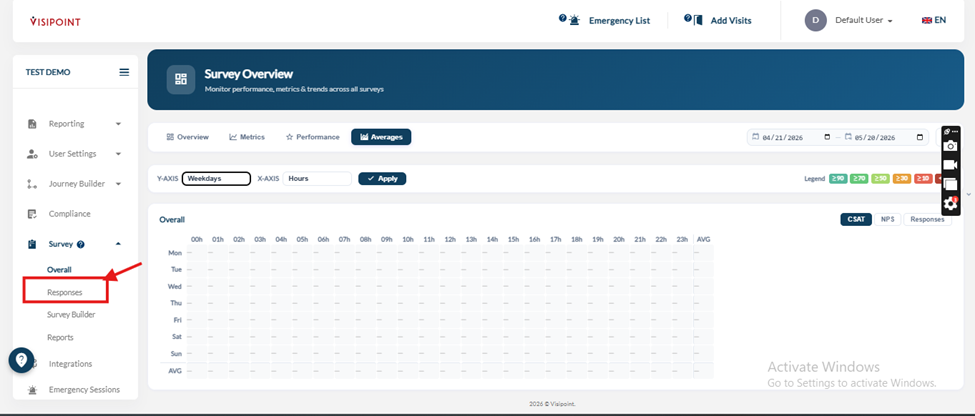
- Then the averages overview (you can filter by the weekends or weekdays and also filter by the hours.
To check the responses, you go to responses.
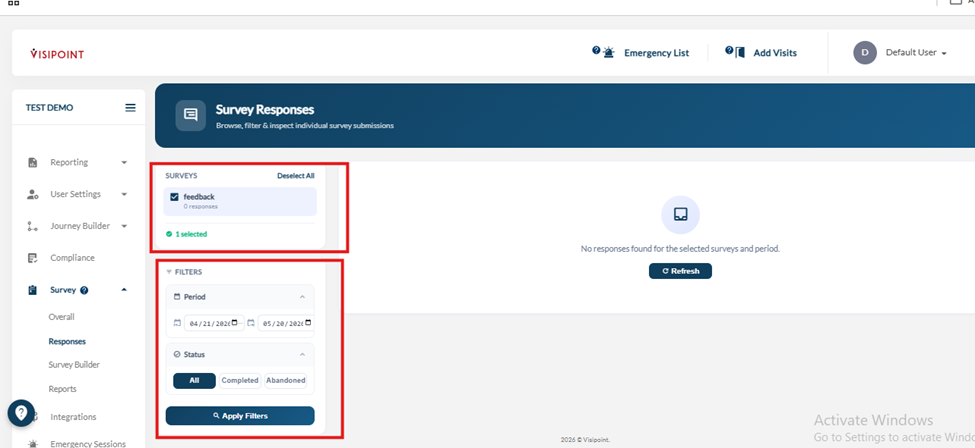
You choose the survey you want to check the responses for, and filter by date and also filter by the status of the survey (completed- abandoned in the middle or all options).
The last one is reports, and this feature allows you to create your own report or compare reports created previously.
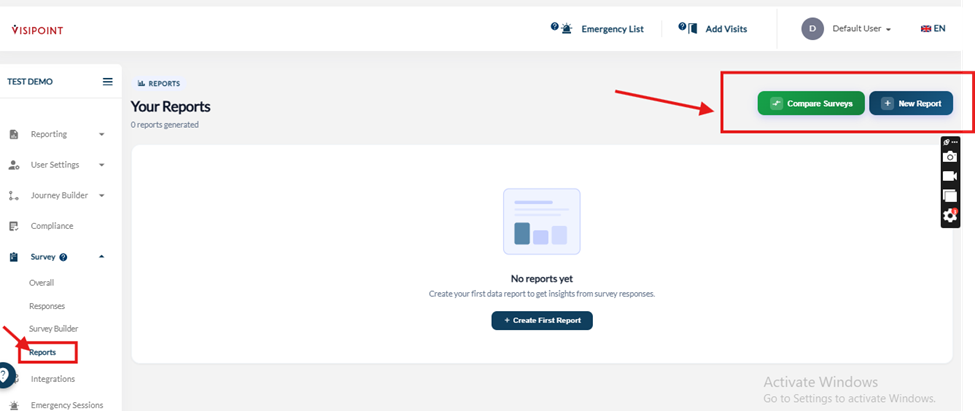
Once we click on the new report, we can choose the name of the report and choose the survey for which we want to create a report.
Then you can choose where the data will be coming from, an online survey our a survey done on the screen on site.
You can choose the dates and the time period for the report; you can choose to compare it to a previous report.
Then you can choose where to deliver the report.