Introduction to the dashboard
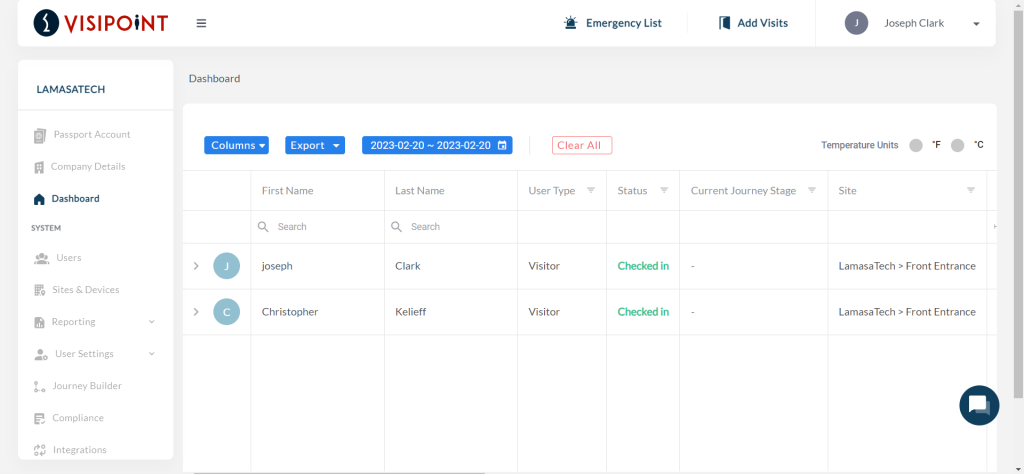
Once you log in to your VisiPoint Cloud account, you will be presented with the dashboard. The dashboard shows quick statistics at the top including the number of users signed in that day, and the grid, which shows your entry logs of logged-in users and denied users. This data is in real-time sync with your kiosks.
Grid settings and filters
Column Chooser
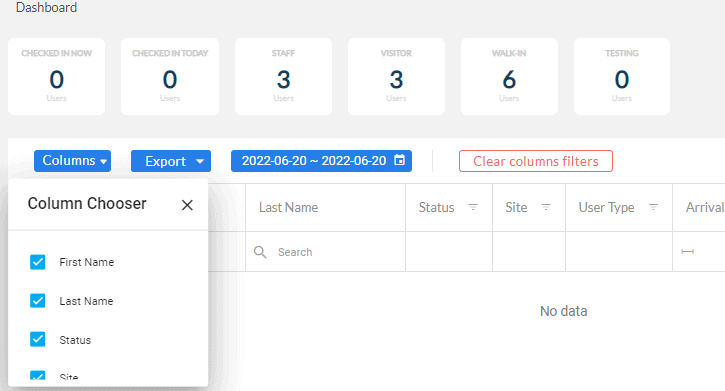
Each grid will have a column chooser dropdown. This allows you to choose which fields are displayed on your grid by ticking the box next to the field in the dropdown.
Export your logs
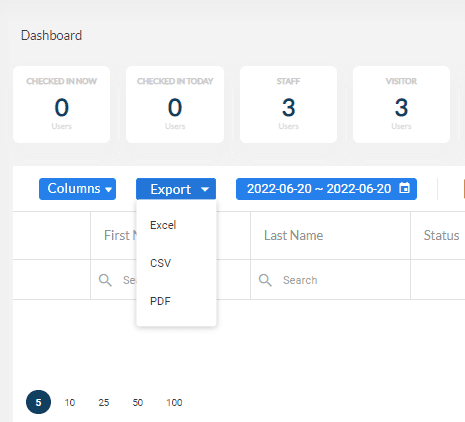
The export button allows you to export your data in Excel, CSV, or PDF format. The data that is exported is what is currently selected on your grid – based on your filters.
Number of records to display
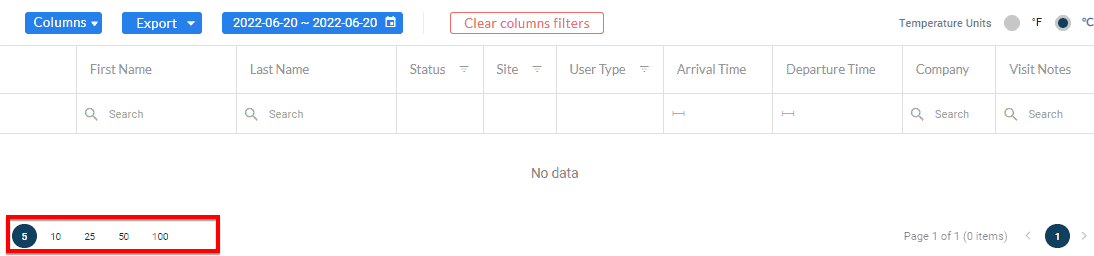
At the bottom of the grid area, you will see a number on the left that will allow you to choose how many logs are presented per page. You can choose between 10 to 100 based on your preference.
Date Filter
You will be able to choose a date range to be displayed on the grid. To clear the date filter you can click on the red ⦻.
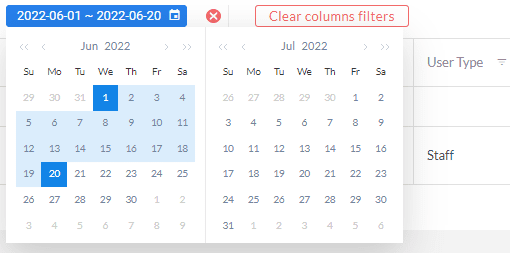
Clear Filter
After you filter any of the columns in the grid, such as user type, area or arrival time, you will be able to clear the grid filtration by clicking on the Clear column filters button.
Visit Details
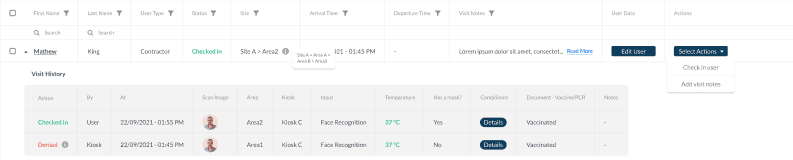
The grid has filter options that include multi-select, so you can narrow your search or filter right down to specific items on the grid.
You just need to click on the filter box (the field name at the top of each column) and a drop-down menu will show a filtering option.
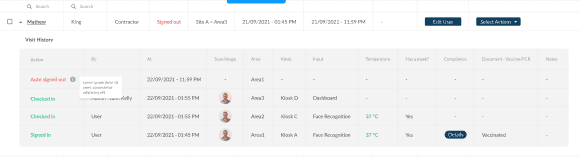
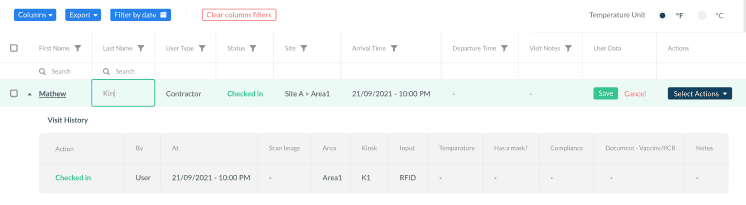
Each row represents a visit for a specific user, per day. You can expand the visit using the arrow on the left. When the visit is expanded, all the users’ scans/actions will be displayed. This means that if the user signs in/out multiple times in a day, or signs into multiple areas on the same day, all actions are grouped for that user under one visit.
If you click on the info symbol ⓘ, the grid will display an explanation of the action taken, if it is not simply sign-in/out or check-in.
Each visit has the following details:
- All the user details (ID – first name – last name – email address – phone number – RFID – company name )
- All the visit details (status – site – user type – arrival time – departure time – visit notes)
In the Site column, the last known location for that user (site > area) will be displayed. You can use the filter to filter by site/area to view all the users who are currently signed into the selected locations.
When you expand a visit, the visit history grid shows for that visit. This displays all actions/scan details for that user on one day. The By column indicates who took the action. For example,
- The action “Denied” is taken by “Kiosk”
- The action “Checked in” or “Signed in” or “Signed out” is taken by “User” or “Admin”
- The action “Auto signed in” or “Auto signed out” by “System”
The Input will display one of the following values: Face Recognition, RFID, QR Code or Manual Sign-in (if the user uses touch mode to enter their details on the kiosk).
The data appears in real-time, so any new action or visit will appear in the grid instantly.
Edit user details in the grid
You can edit a user from the grid by clicking the Edit User button under User Data.
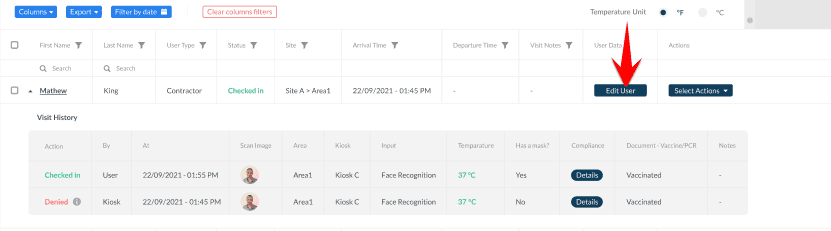
This highlights the user’s row in green. You can then edit the user’s details by typing directly into the fields. You can only edit the user’s details, such as name. You cannot edit the visit details. This is to prevent skewed records and logs.
Temperature unit selection
In the right section above the grid area, you will have the option to control the temperature unit displayed on the grid, to display the temperature in Fahrenheit or Celsius.
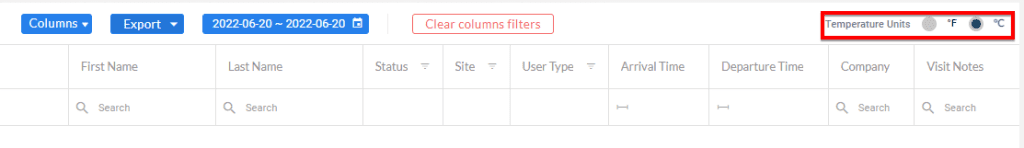
This won’t affect the kiosk settings for the temperature threshold. However, the temperature unit on the dashboard will be converted for your grid and reports, if you choose the opposite unit from what is selected in the kiosk settings. For example, if you have the temperature threshold in Fahrenheit on your kiosk, but choose Celsius on the grid.